EDITORIAL: ‘Chart of the century’ shows how government drives inflation


The short- and long-term causes of inflation are clear — if you know where to look.
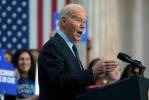
The American public doesn’t approve of President Joe Biden’s handling of the economy. An ABC/Ipsos poll from this month found only 13 percent of people said they’re doing better now financially than when Mr. Biden took power. Unsurprisingly, Mr. Biden is deeply underwater on the economy, 31 percent approving to 56 percent disapproving.
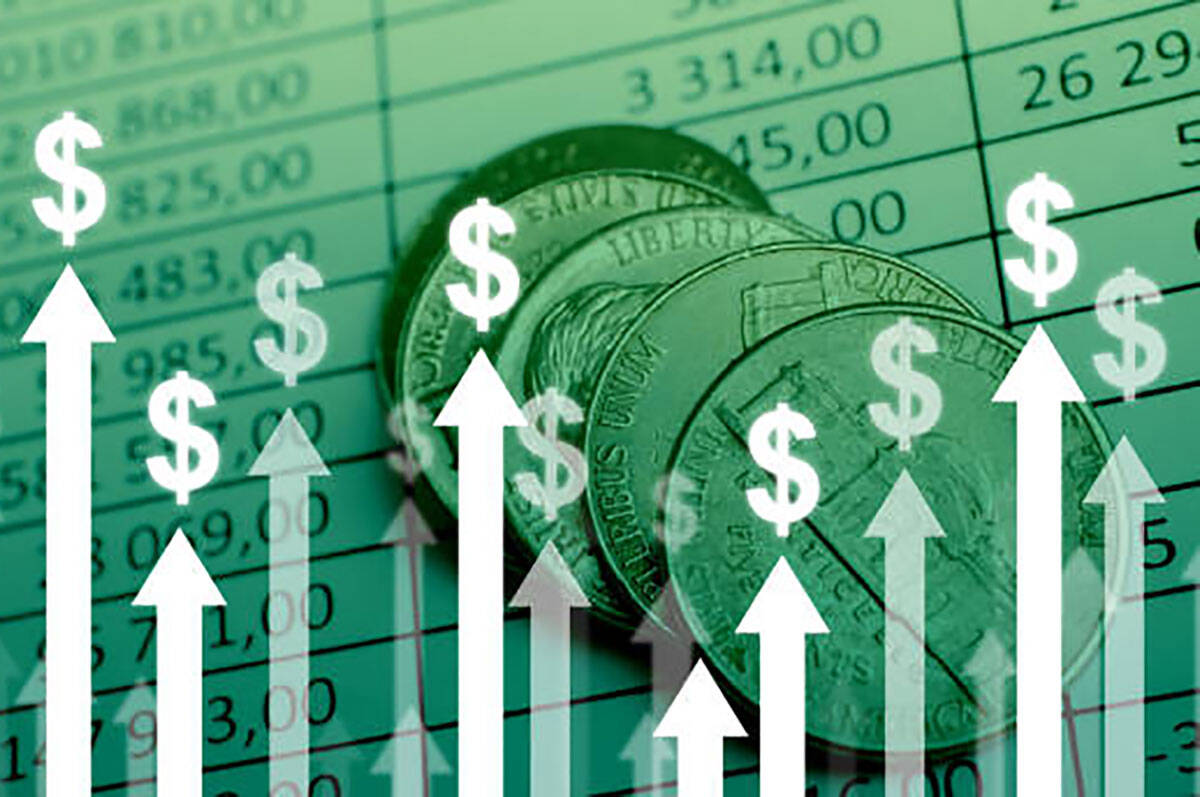
The root of this disapproval is inflation. The annual inflation rates during his tenure have been 7 percent, 6.5 percent and 3.4 percent. The Federal Reserve’s target inflation rate is 2 percent. That means inflation last year was 70 percent above that goal. Making things worse, that 3.4 percent built off of the two previous years of extremely high inflation.
In this case, it’s not hard to figure out what caused prices to jump. After Mr. Biden was elected, the economy was poised to explode out of its shutdown-induced pandemic paralysis. But the president and congressional Democrats rammed through a $1.9 stimulus package called the American Rescue Plan. It sent $1,400 checks to individuals, extended unemployment benefits and gave hundreds of billions to state and local governments. The worst inflation in four decades followed.
But this is far from the first time that government interventions led to higher prices. Mark Perry, a senior fellow emeritus with the American Enterprise Institute, recently published an updated version of what he appropriately calls the “Chart of the Century.” It shows price increases in certain goods from 2000 to the end of 2023.
Overall, inflation has been 82.4 percent. But some items have increased much more dramatically than that. Hospital services are up 243.7 percent. College tuition and fees are 184.7 percent higher. Child care and nursery school is up 132.8 percent. Housing has nearly doubled, at 96.2 percent increase.
But some categories have remained steady or even dramatically decreased. The cost of TVs dropped 97.9 percent. Computer software is down 72.4 percent. Cellphone services fell 41.3 percent. Cars have gone up 26.2 percent, but costs remained basically flat until 2020, when the pandemic disrupted supply chains.
The pattern jumps off the page. In categories where there is heavy government involvement and regulation, prices soared. In areas where companies have the freedom to innovate and compete, prices plummeted or at least remained relatively stable.
College and health care are prime examples. Over the decades, the federal government has gotten more and more involved in those economic sectors. Politicians often justify such interventions by noting the dramatic increase in prices. Turns out they have it backward.