The Hylo Park and Gateway Village are two mixed-use projects in North Las Vegas. Though they started at different points, both projects could finish at similar times.


The Hylo Park and Gateway Village are two mixed-use projects in North Las Vegas. Though they started at different points, both projects could finish at similar times.

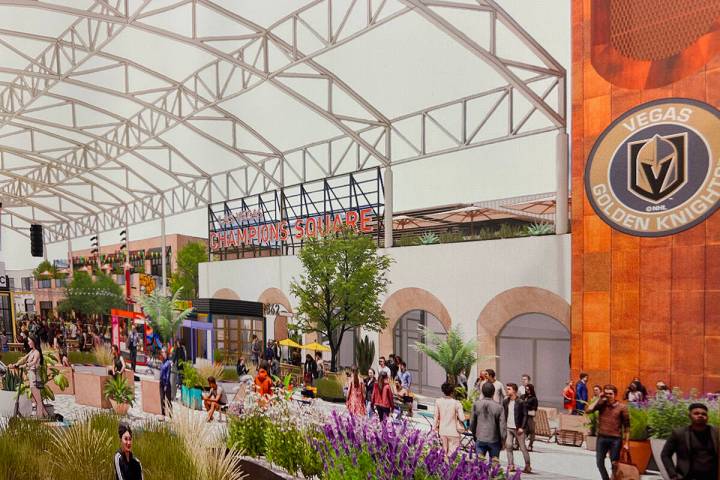
The 100,000-square-foot center, replacing an aging office complex, will include restaurants, culinary kiosks and a covered alfresco dining lounge.

Terrell Rhodes pleaded guilty in a Las Vegas court to killing his girlfriend’s 2-year-old son, Amari Nicholson, in 2021.

Matt McMullen has been at it for decades. His most realistic creation yet is a supermodel-esque woman with blonde-brown hair who speaks with a mild Scottish accent.

Two Henderson parents have been arrested on suspicion on child abuse after police found an 11-year-old inside a large metal enclosure inside a residence.

The first incident was reported to have happened about 2:45 p.m. Wednesday and a second incident about 3:10 p.m., both near Paradise Hills Drive and Greenway Road.
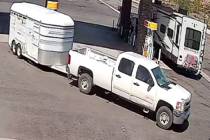
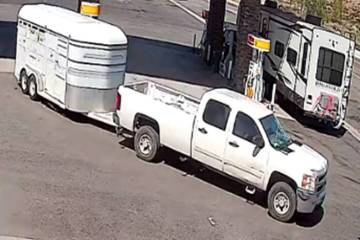
The Nevada Department of Wildlife is asking the public for help in identifying two suspects. If not found by rangers, the turkeys would have died in the wild.

The number of passengers using Harry Reid International Airport in March was the third highest in the airport’s history, with international travel fueling that growth.

It seemed possible the former president could still benefit from a lengthy trial delay, possibly beyond November’s election.
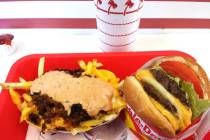
In-N-Out’s “secret menu” includes items ranging from pimped-out cheeseburgers to something called a whole grilled onion.

A teen and his stepdad were killed after five members of the same family were struck by an alleged impaired driver at a Las Vegas bus stop.
A federal agency alleged a downtown hotel-casino discriminated against employees multiple times since at least 2018.

The class-action lawsuit estimates more than 1,000 Las Vegas restaurants may have been affected by “false identities” on the Uber Eats website.

Golden Knights goaltender Logan Thompson was stellar in net in a victory over the Dallas Stars in Game 2 of the first-round playoff series Wednesday.

Thousands of glowing lanterns are set to illuminate the desert sky just outside of Las Vegas as part of an upcoming family-friendly event during Mother’s Day weekend.

Today, we stand at a pivotal crossroads, a moment characterized by the stark contrast between the cautious embrace of technology by our parents and grandparents and the seamless integration of digital tools into the lives of younger generations. The older generations approached each new device with a blend of awe and skepticism, some even steadfastly […]


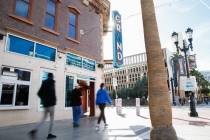
Locals can watch movies every Monday evening starting in May on the Strip hotel’s 65-foot digital marquee.

The win was one of several recently across the Las Vegas Valley.

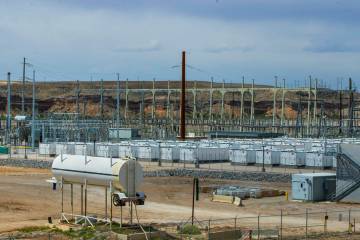
Multiple government bodies are attacking the problem of forever chemicals head on, especially with new regulations handed down from the Environmental Protection Agency.

The Raiders and NV Energy joined forces to provide eventgoers at Allegiant Staidum with the ability to charge electric vehicles.