Is Nevada’s COVID positivity rate 46%, 18% or 9%? We explain.


Nevada’s positivity rate of new COVID-19 tests is increasing, but state officials confirmed that Johns Hopkins University published an extremely high rate this week that is erroneous.
Johns Hopkins calculated the seven-day moving average positivity rate at 46 percent Tuesday, indicating that almost half of all Nevada’s COVID-19 test results in the past week had come back positive.
It’s a huge number that puts Nevada well above the national average. It’s also incorrect, state officials say, because of a major change Nevada health officials made in the COVID-19 data reporting portal last week.
Gov. Steve Sisolak said Tuesday that the state Department of Health and Human Services had confirmed with Johns Hopkins that the university’s rate was wrong and should soon be corrected.
Johns Hopkins’ rate is “twice above the highest we’ve ever seen,” said UNLV epidemiologist Brian Labus, who serves on Sisolak’s medical advisory board for COVID-19.
“I had our DHHS call them and explain how we got to our rate, and they agree,” Sisolak said. “It’s just a matter of communicating it to the right people.”
On Oct. 15, Nevada officials changed how they measure positivity rate to focus more on moving averages and less on daily numbers. The change in how the key coronavirus metric is calculated has led to confusion for some, largely because they are seeing different rates from different sources.
Other rates that have been used: The Review-Journal has reported the state’s seven-day moving positivity rate using a formula similar to that of Johns Hopkins. That rate was 17.8 percent as of Tuesday.
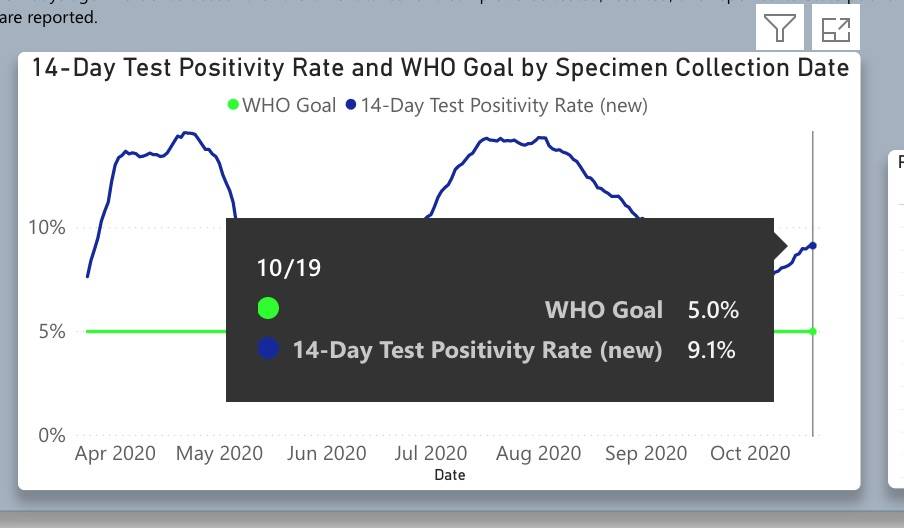
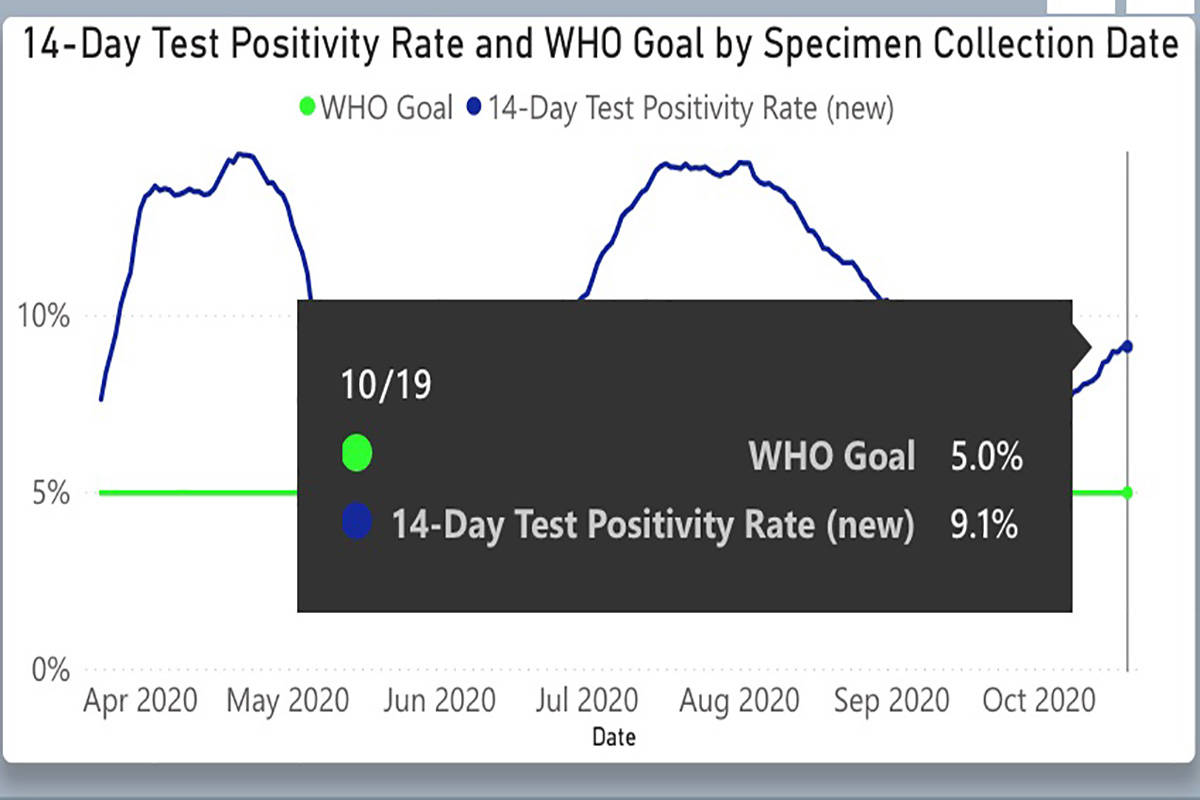
Nevada state officials now measure and publish a 14-day moving average with a different formula. That rate sat at 9.1 percent as of Tuesday.
Nevada’s 14-day moving average has steadily trended upward since mid-September, when it hit a low of 6.5 percent.
Sisolak said that in its most recent weekly report, the White House Coronavirus Task Force placed Nevada in the “orange zone” for its test positivity rate, which was the 16th highest in the nation.
“It’s never a good sign when the numbers are increasing,” Labus said. However, “it’s not jumping at a very fast rate. It’s just a slow, steady increase.”
So which rate is best to follow? The answer can be complicated.
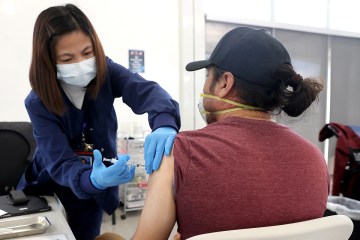
In essence, a state’s positivity rate measures what percentage of its COVID-19 tests have positive results.
It’s an important metric that can provide context when states see a larger or smaller number of new cases. Generally speaking, a higher positivity rate is not a good thing.
But Nevada and other states have changed how they calculate the rate since the novel coronavirus arrived in the U.S. earlier this year. Primarily, the shifts in the Silver State have been made to account for reinfections among residents and helped reduce volatile fluctuations in the data.
“The reason that how we measure test positivity has progressed is just because COVID-19 has progressed,” state biostatisician Kyra Morgan said. “We have to adapt accordingly.”
Changes in metrics
Johns Hopkins’ daily positivity rate for Nevada has been 100 percent every day since Oct. 15. In turn, its seven-day moving average has climbed higher and higher.
The research university’s COVID-19 data aggregation and analysis have often been cited by national media organizations since the beginning of the pandemic.
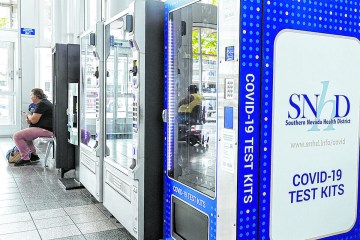
The error started on the same day Nevada changed the format of its COVID-19 data dashboard. Johns Hopkins calculates positivity by dividing a state’s number of COVID-19 cases by the number of cases and negative tests combined, and the updated Nevada dashboard no longer includes how many people have tested negative.
A university representative did not respond to a request for comment Tuesday. Nevada DHHS spokeswoman Shannon Litz said Thursday that the state has also reached out to the COVID Tracking Project, a volunteer organization from which Johns Hopkins receives much of its data.
The Review-Journal’s measure of the seven-day moving average is based on how Nevada officials measured positivity rates near the beginning of the state’s outbreak.
The number of people who have tested positive is divided by the number of people tested. So even if one person received multiple tests, he or she would be counted only once. Lab results are assigned to the date the state received them, not the date a person was tested.
Since Sunday, the Review-Journal’s seven-day moving average has fluctuated between about 18 percent and 20 percent. The rate has seen a recent series of peaks and valleys but generally has increased since a low of 9.2 percent in mid-September.
Now, Nevada state officials are measuring each “testing encounter” a person has. So an individual could be tested multiple times throughout the pandemic, and each test would count toward the state’s positivity rate, but no more than one “testing encounter” per day.
Results are assigned to the date an individual’s testing specimen was collected, and the state has stopped measuring the cumulative and seven-day average rates in favor of a 14-day average.
Additionally, “the best measure that we have for when transmission occurred is actually when a person got tested,” Morgan said. “That’s a lot more accurate than the date that we found out about the test.”
Contact Michael Scott Davidson at sdavidson@reviewjournal.com or 702-477-3861. Follow @davidsonlvrj on Twitter.